Executive Report
Data-dense, executive style for professional reports. Focuses on statement-driven "Action Titles", rigorous grid structures, and professional high-fidelity visuals.
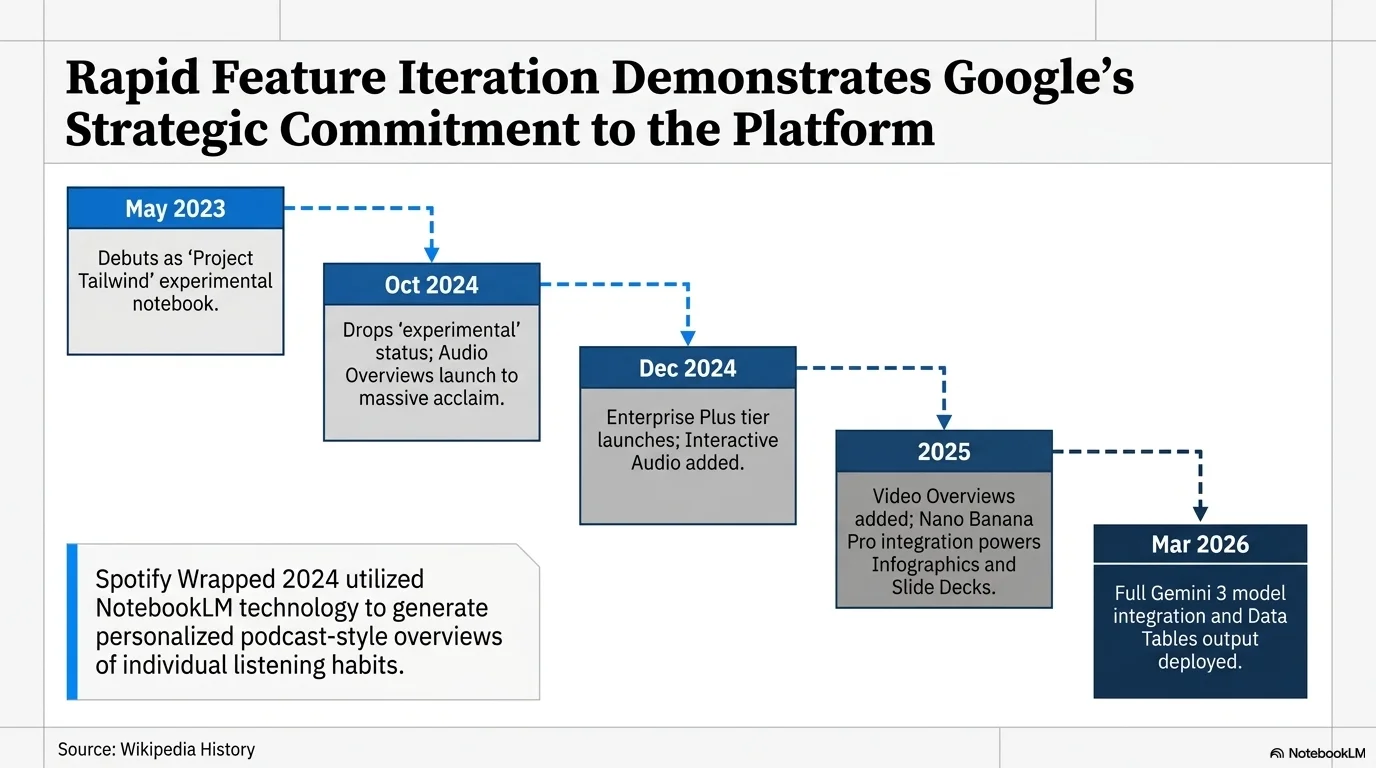
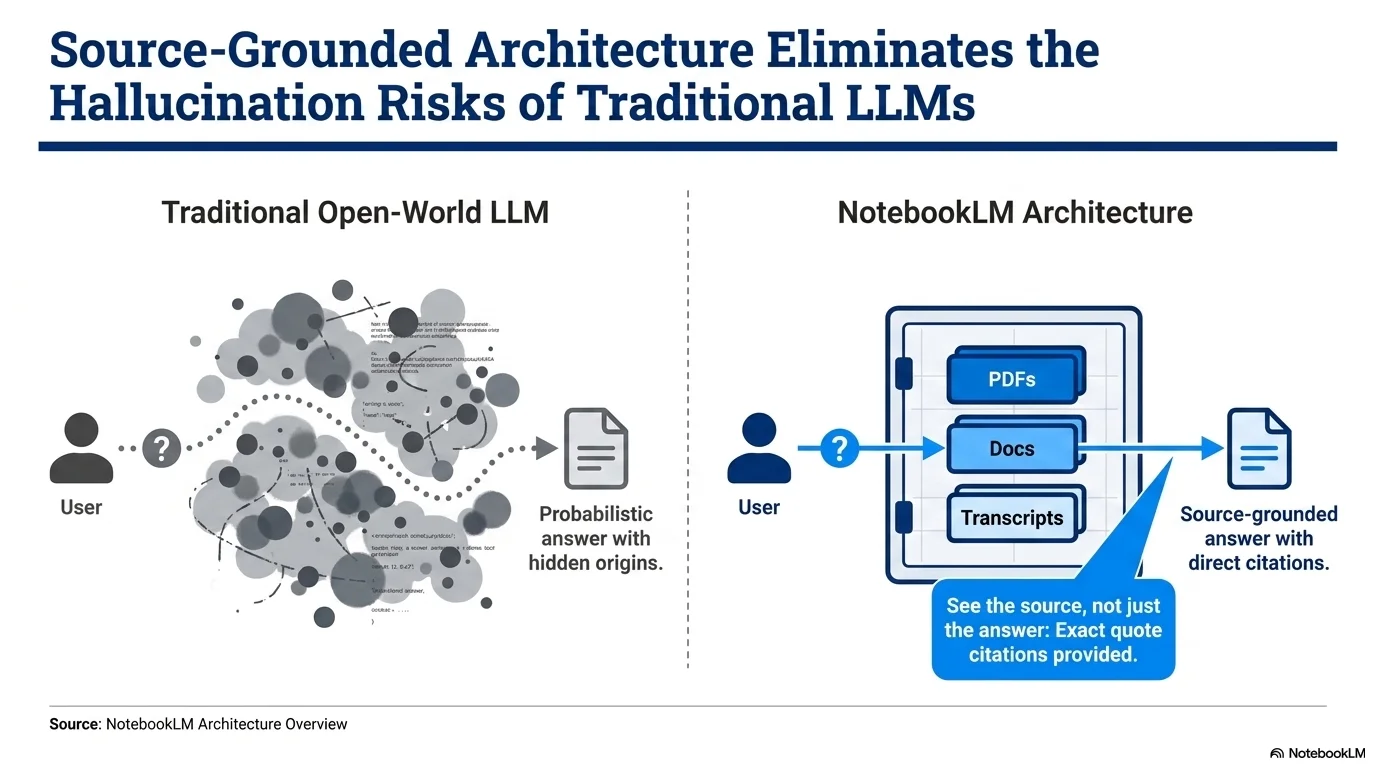
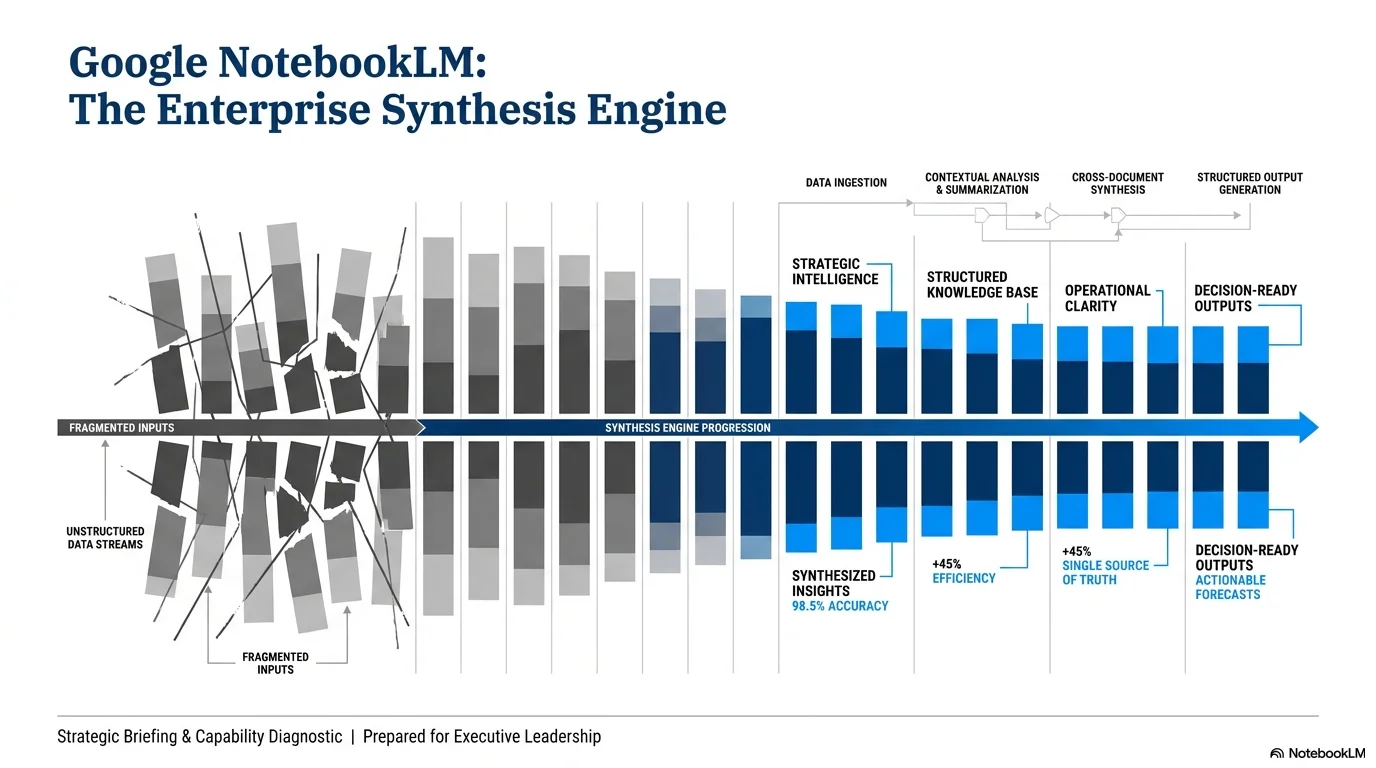
Palette
- Primary
#051C2C - Background
#FFFFFF - Text
#333333
Typography
- primary heading
- Authoritative serif (e.g., Times New Roman, Georgia), bold, statement-driven
- secondary heading
- Clean professional sans-serif (e.g., Helvetica, Arial), bold
- body text
- Functional sans-serif, standard weights, high density
Key visual elements
- Full-width horizontal dividers for header and footer separation
- High-information density
- Source and Footer attribution blocks
- Waterfall and Stacked bar chart motifs in icons
YAML
design_system:
  global_style:
    theme: "Professional, data-dense, and executive. Inspired by high-end consulting standards. Focuses on statement-driven 'Action Titles', rigorous grid layouts, and high-impact data visualization."
    typography:
      primary_heading: "Authoritative serif (e.g., Times New Roman, Georgia), bold, statement-driven"
      secondary_heading: "Clean professional sans-serif (e.g., Helvetica, Arial), bold"
      body_text: "Functional sans-serif, standard weights, high density"
    color_palette:
      primary_color: "#051C2C" # Deep Blue
      background: "#FFFFFF"    # Executive White
      text_main: "#333333"     # Charcoal Gray
      accent_color: "#007DBB"  # Bright Blue (highlights)
      secondary_accent: "#999999" # Light gray for dividers and sources
    key_visual_elements:
      - "Full-width horizontal dividers for header and footer separation"
      - "High-information density"
      - "Source and Footer attribution blocks"
      - "Waterfall and Stacked bar chart motifs in icons"

  image_generation_prompts:
    style_guidelines: "Clean professional white background, deep blue accents, business-centric data visualization, executive presentation style, high-fidelity charts."
    themes:
      - target: "Data Dashboard"
        prompt_elements: "Minimalist executive dashboard, stacked bar charts in blue and gray, sharp vector lines, professional vibe."

slide_layout_templates:
  - type: "Executive_Action_Title"
    usage: "Standard consulting slide with a key insight title"
    components:
      - "Header: Bold serif Action Title in Deep Blue"
      - "Body: 3-column analysis grid with blue accent dividers"
      - "Footer: Source attribution and slide number in small gray text"

  - type: "Waterfall_Insight"
    usage: "Dynamic financial or process flow"
    components:
      - "Layout: Central waterfall chart visualization"
      - "Annotation: Clean text call-outs for primary drivers"

  - type: "Quad_Analysis"
    usage: "Comparison of four key metrics"
    components:
      - "Layout: 2x2 grid of sharp-cornered cards"
      - "Visual: Consistent color coding across all four quadrants"






Connect & Share